Five Number Summary
Calculate the five number summary (minimum, Q1, median, Q3, maximum) for your dataset. Enter your numbers separated by commas or spaces.
What is Five Number Summary?
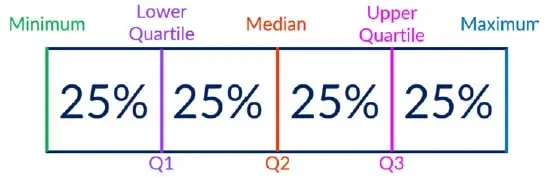
The Five Number Summary is a statistical method introduced by statistician John Tukey in 1977 that provides a quick overview of a dataset's distribution. It consists of five key values: minimum, first quartile (Q1), median (Q2), third quartile (Q3), and maximum.
As one of the core tools in Exploratory Data Analysis (EDA), the Five Number Summary can comprehensively and robustly describe the distribution characteristics of data using just five key numbers. This method is not only simple to calculate but also provides far more information than a single mean value, making it particularly suitable for quickly understanding the overall picture of data during the preliminary data analysis phase.
Key Components
- Minimum (Min): The lowest value in the dataset, reflecting the minimum level of the variable.E.g., in real estate analysis, the minimum shows the most affordable house price on the market.
- First Quartile (Q1): Also called the lower quartile, it separates the lowest 25% of the data from the rest.E.g., in test score analysis, Q1 can help identify students in the bottom 25%.
- Median (Q2): The center of the data, dividing the dataset into two equal parts.E.g., in income analysis, the median income often better reflects the typical level than the mean, as it is less affected by extreme values.
- Third Quartile (Q3): Also called the upper quartile, it separates the highest 25% of the data from the rest.E.g., in product size analysis, Q3 can help determine the upper size limit for most products.
- Maximum (Max): The highest value in the dataset.E.g., in climate analysis, the maximum temperature record can help identify extreme weather events.
Why Use Five Number Summary?
In today's big data era, we encounter massive amounts of data information on a daily basis. When faced with such data, how to quickly and effectively grasp its distribution characteristics has become a problem that every data analyst must solve. While traditional measures like mean and standard deviation are commonly used, they can often be misleading when data exhibits skewed distributions or contains outliers.
The Five Number Summary demonstrates its unique value precisely in this context. These values help identify the center, spread, and shape of data distributions, and are commonly used to create box plots and detect outliers. This robust statistical method provides a comprehensive yet simple way to understand data patterns without being overly influenced by extreme values.
Robust to Outliers
Unlike mean and standard deviation, the five number summary is resistant to extreme values and provides a more reliable picture of data distribution.
Quick Overview
Provides immediate insight into data distribution, center, spread, and shape with just five numbers, making it perfect for exploratory data analysis.
Visual Foundation
Essential for creating box plots and other statistical visualizations that effectively communicate data patterns to stakeholders.
Key Advantages Over Traditional Measures
Traditional Measures (Mean, SD)
- • Sensitive to outliers
- • Can be misleading with skewed data
- • Requires normal distribution assumptions
- • Limited insight into data shape
Five Number Summary
- • Robust against outliers
- • Works with any distribution shape
- • No distribution assumptions needed
- • Reveals data shape and spread
How the Five Number Summary is Calculated
Arrange the data in ascending order.
Find the minimum and maximum values.
Calculate the median (Q2), which divides the dataset into two halves.
Calculate the first quartile (Q1), which is the median of the lower half of the data (excluding the overall median if the dataset has an odd number of observations).
Calculate the third quartile (Q3), which is the median of the upper half of the data (excluding the overall median if the dataset has an odd number of observations).
Examples
Example 1: Odd Number of Data Points (n = 9)
Original dataset (Math test scores of 9 students, out of 100):
- Step 1: Sort the data
Sorted: [60, 65, 70, 78, 83, 85, 88, 92, 95] - Step 2: Find the minimum and maximum
Min: 60 Max: 95 - Step 3: Calculate the median (Q2)
n = 9 (odd), median position = (9+1)/2 = 5th value
Q2: 83 - Step 4: Calculate the first quartile (Q1)
Lower half (excluding the median): [60, 65, 70, 78]
n = 4 (even), Q1 position = (4+1)/2 = 2.5 → average of 2nd and 3rd values
Q1: (65 + 70) / 2 = 67.5 - Step 5: Calculate the third quartile (Q3)
Upper half: [85, 88, 92, 95]
n = 4 (even), Q3 position = (4+1)/2 = 2.5 → average of 2nd and 3rd values
Q3: (88 + 92) / 2 = 90
Example 2: Even Number of Data Points (n = 10)
Original dataset (Daily sales for 10 consecutive days, in $10,000s):
- Step 1: Sort the data
Sorted: [3.8, 4.0, 4.2, 4.5, 4.9, 5.0, 5.2, 5.7, 6.1, 6.5] - Step 2: Find the minimum and maximum
Min: 3.8 Max: 6.5 - Step 3: Calculate the median (Q2)
n = 10 (even), median position = (10+1)/2 = 5.5 → average of 5th and 6th values
Q2: (4.9 + 5.0) / 2 = 4.95 - Step 4: Calculate the first quartile (Q1)
Lower half: [3.8, 4.0, 4.2, 4.5, 4.9]
n = 5 (odd), Q1 position = (5+1)/2 = 3rd value
Q1: 4.2 - Step 5: Calculate the third quartile (Q3)
Upper half: [5.0, 5.2, 5.7, 6.1, 6.5]
n = 5 (odd), Q3 position = (5+1)/2 = 3rd value
Q3: 5.7
About This Calculator
This Five Number Summary Calculator is designed to help students, researchers, and data analysts quickly compute the essential statistical measures for their datasets. Our tool provides instant calculations with detailed step-by-step explanations to enhance your understanding of statistical concepts.
Features
- • Instant calculation with real-time results
- • Step-by-step calculation breakdown
- • Support for various data formats
- • Educational explanations and examples
- • Mobile-friendly responsive design
Perfect For
- • Statistics students and educators
- • Research data analysis
- • Quality control and monitoring
- • Business intelligence reporting
- • Academic research projects
Deep Insights & Important Notes
When working with the five number summary, there are several key points and caveats to keep in mind:
- Sample Size Matters: The five number summary is less meaningful for very small samples (n < 5). It's recommended to have at least 10 data points for meaningful quartiles. For tiny samples, consider reporting all raw data points instead.
- Grouped Data: When working with grouped data (e.g., age groups: 0-10, 11-20), special methods are needed to estimate quartiles, and results may have some error.
- Continuous vs. Categorical Variables: The five number summary is best for continuous variables. For categorical or ordinal data (like Likert scale survey responses), use caution and consider other methods.
- Missing Data: If your dataset contains missing values, decide whether to remove or impute them before calculation. Your choice can affect the final results.
- Software Differences: Different statistical software (e.g., R, Python, SPSS) may use slightly different methods to calculate quartiles. Always specify the method used when reporting results.
- Relation to Standard Deviation: While the five number summary doesn't directly calculate standard deviation, you can use the interquartile range (IQR = Q3 - Q1) to measure spread. For normal distributions, IQR ≈ 1.35σ.