Five Number Summary Calculator
Enter your dataset below to instantly compute the five number summary (minimum, Q1, median, Q3, and maximum). helping you analyze your data quickly and accurately. Supports comma, space, or semicolon separated values.
How the Five Number Summary is Calculated
What is the Five Number Summary?
The five number summary is a statistical method that provides a quick overview of your data distribution using just five key values: minimum, first quartile (Q1), median (Q2), third quartile (Q3), and maximum.
This powerful tool helps you understand the center, spread, and shape of your data without being affected by extreme outliers.
When to Use It
- • Exploratory data analysis
- • Comparing multiple datasets
- • Identifying outliers
- • Understanding data distribution
- • Creating box plots
Step-by-Step Calculation Process
Step 1: Data Preparation
Ensure your data consists of numerical values (integers or decimals) separated by commas, spaces, or semicolons. The calculator automatically cleans and validates your input.
Step 2: Data Sorting
Your data is automatically sorted in ascending order (from smallest to largest) to prepare for calculation.
Step 3: Calculate Core Values
Minimum & Maximum
The smallest and largest values in your dataset.
Median (Q2)
The middle value that divides your data into two equal halves.
First Quartile (Q1)
The median of the lower half of your data.
Third Quartile (Q3)
The median of the upper half of your data.
Step 4: Special Cases
For datasets with only 3 values, Q1 equals the minimum and Q3 equals the maximum, ensuring meaningful results even with limited data.
Understanding Your Results
What Each Value Tells You
- Minimum: The lowest value in your dataset
- Q1: 25% of your data falls below this value
- Median: The center of your data distribution
- Q3: 75% of your data falls below this value
- Maximum: The highest value in your dataset
Key Insights
- • Range: Maximum - Minimum shows data spread
- • IQR: Q3 - Q1 shows middle 50% spread
- • Skewness: Compare median position to detect asymmetry
- • Outliers: Values beyond 1.5 × IQR from Q1/Q3
Examples
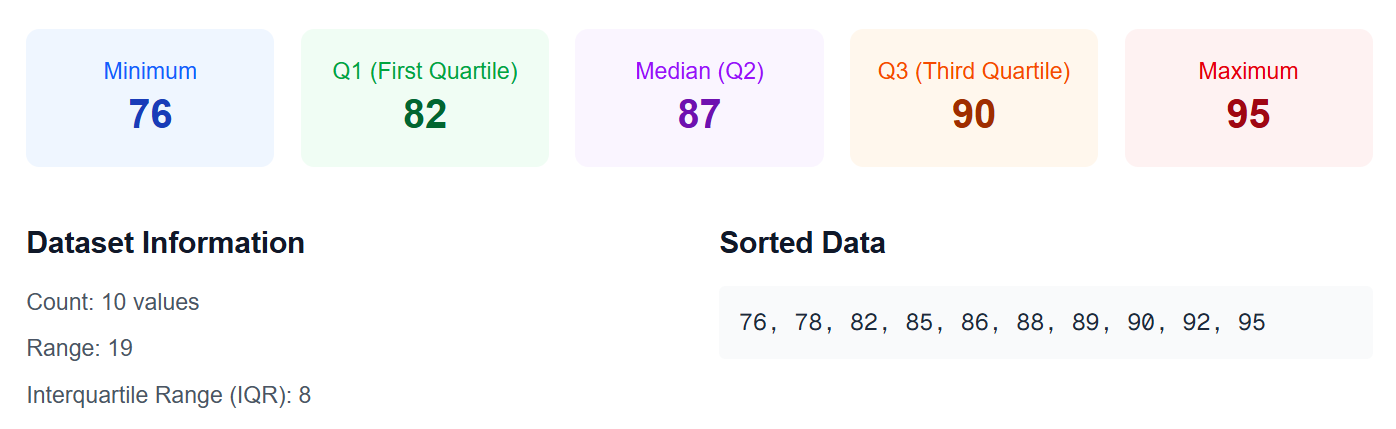
Dataset 1: Student Test Scores
- Minimum: 76
- Q1: 82
- Median (Q2): 87
- Q3: 90
- Maximum: 95
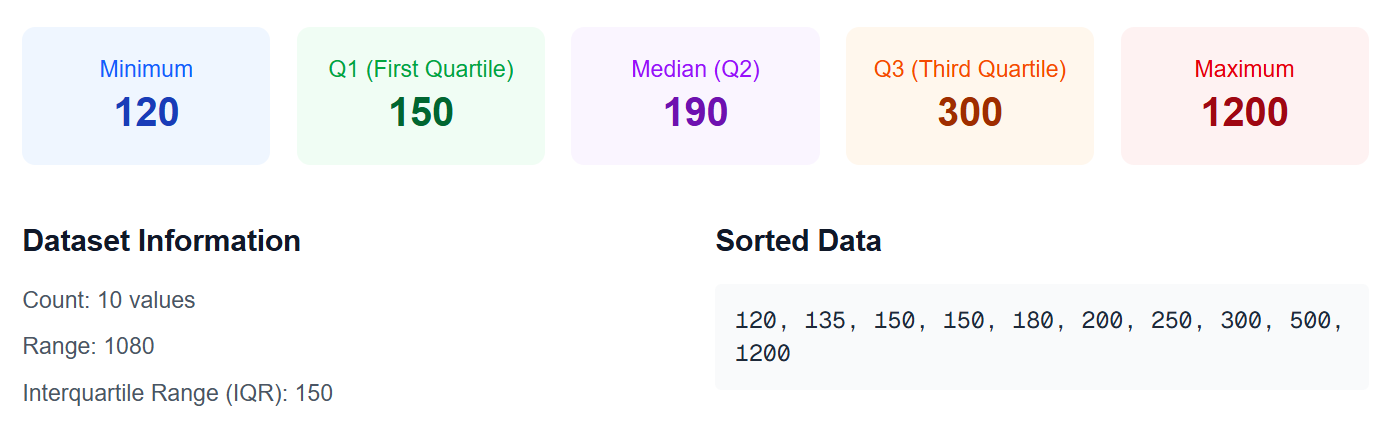
Dataset 2: E-commerce Order Amounts
- Minimum: 120
- Q1: 150
- Median (Q2): 190
- Q3: 300
- Maximum: 1200
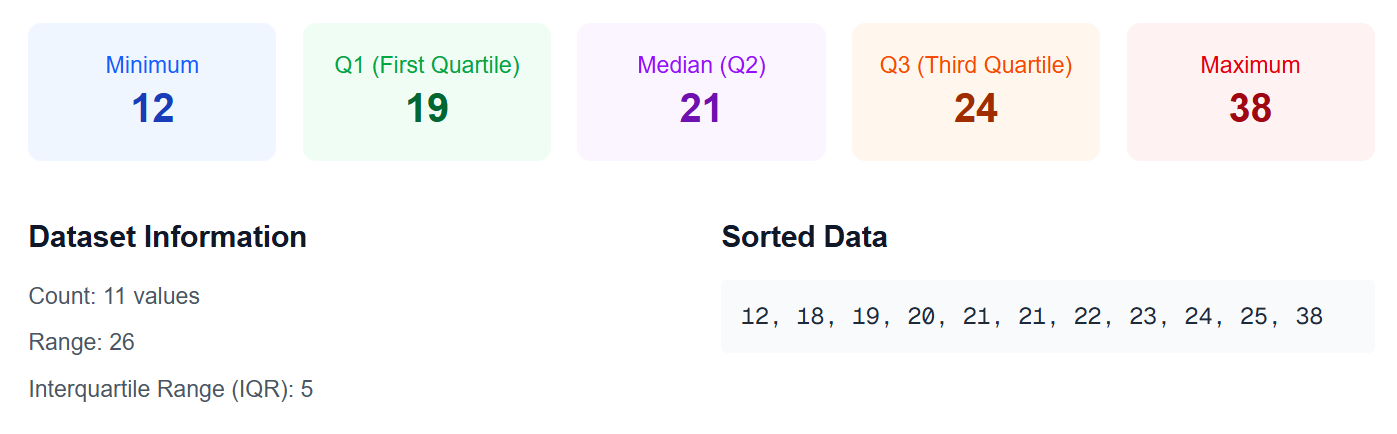
Dataset 3: Daily Temperature Records (°C)
- Minimum: 12
- Q1: 19
- Median (Q2): 21
- Q3: 24
- Maximum: 38
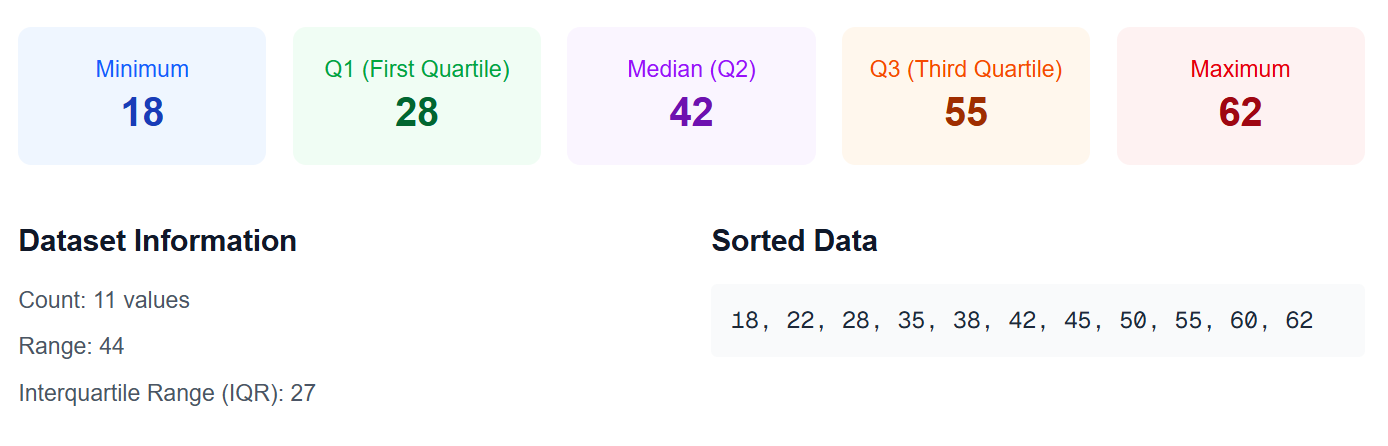
Dataset 4: City PM2.5 Index
- Minimum: 18
- Q1: 28
- Median (Q2): 42
- Q3: 55
- Maximum: 62
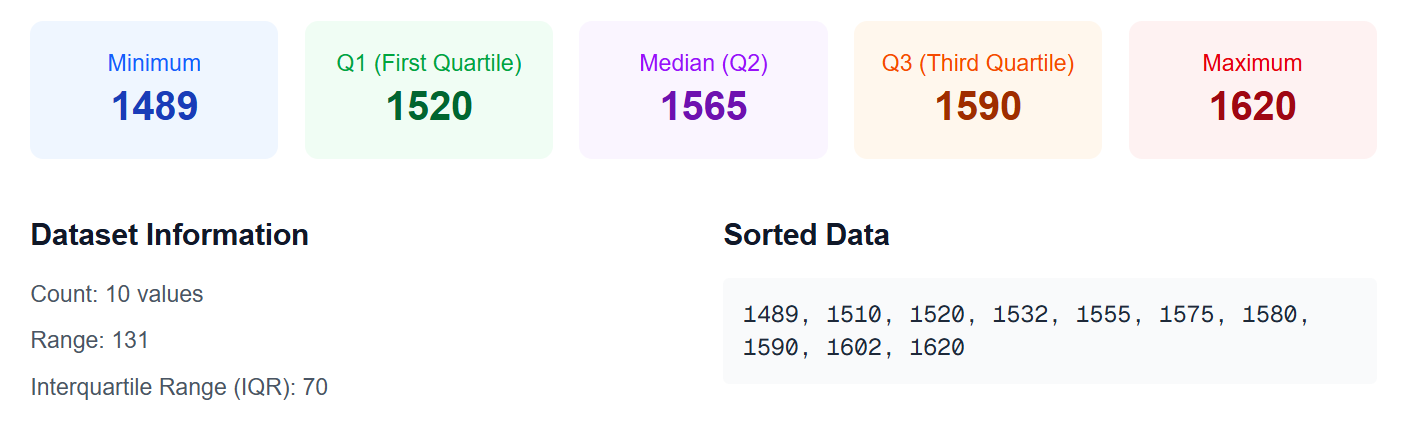
Dataset 5: Daily Active Users of an App
- Minimum: 1489
- Q1: 1520
- Median (Q2): 1565
- Q3: 1590
- Maximum: 1620